

Core Web Vitals (LCP, CLS, INP), navigation timings, JavaScript long tasks, third‑party impact, device/geo breakdowns, and user session context — so you see what real visitors experience, not just lab tests.

 Easy installReal user dataAI First
Real user data is noisy. We use AI to make it actionable.
Our platform is built to connect with your AI tools so you can find and fix the root causes of your performance issues.
Most RUM tools stop at surface-level Core Web Vitals metrics or require complex customisation to track the page metrics that really matter.
Our platform digs into every tag, wrapper, and script so you can see - and fix - the true performance culprits.

Total Visibility
Get deep insights into every tag, wrapper and script dragging down your real-user metrics.
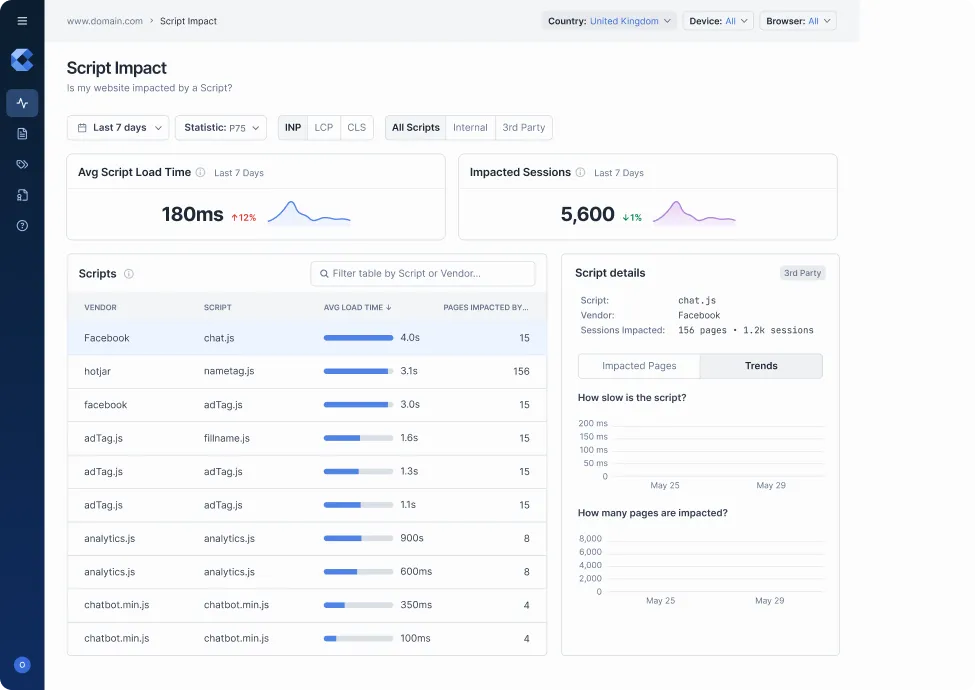
Vendor Impact
Measure the load-time cost of each third-party vendor across devices, browsers and regions.
Speed Gains
Prioritise fixes to boost page speed and deliver faster experiences for real users. AI Technology
Our RUM platform is integrated into our performance consulting framework. Which means it’s backed by real engineering firepower. We don’t just monitor performance; we help you fix what matters. With AI and expert support, we turn noisy user data into high-impact fixes that speed up your site, reduce engineering time, and grow revenue.
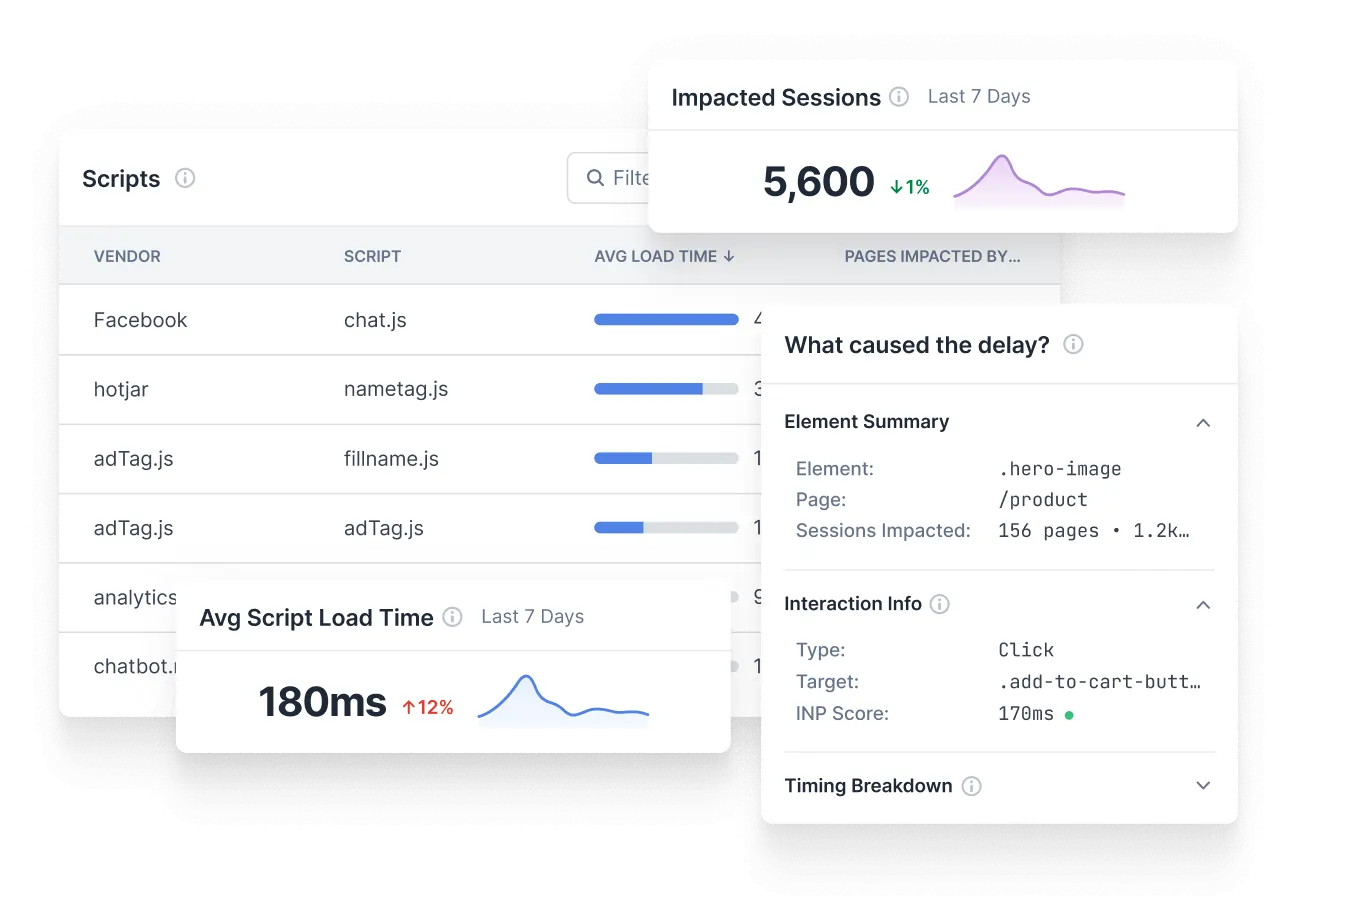

Third Party Script Breakdown
See which tags, wrappers, and scripts are impacting real user performance - by domain, size, and load time.
Fix INP with Confidence
Get specific, actionable insights to improve your site’s Interaction to Next Paint (INP).
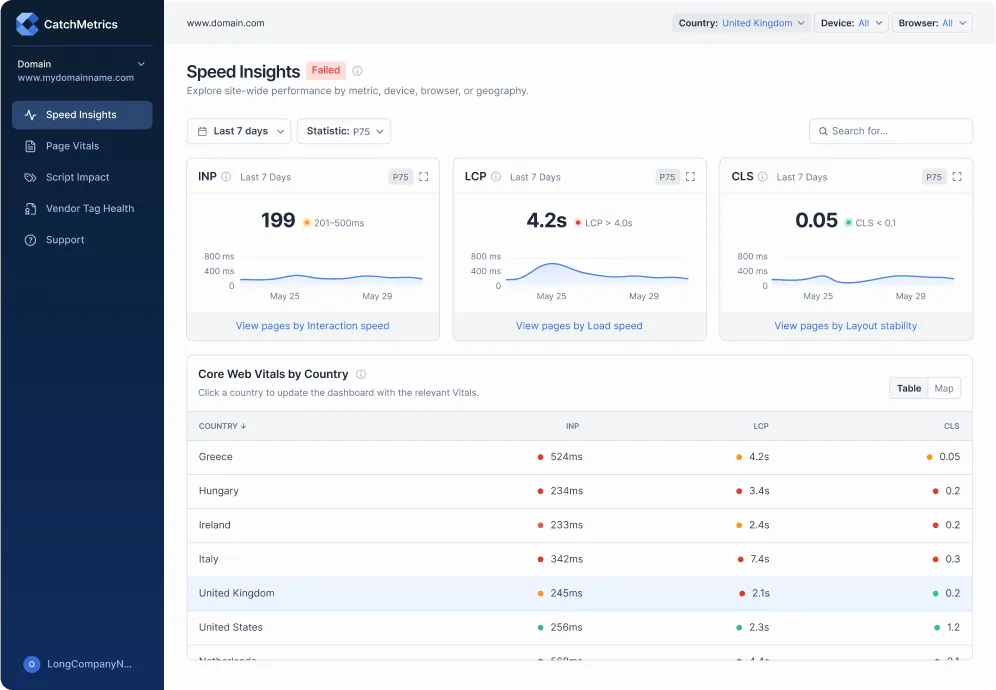
Real-User Monitoring (RUM)
Understand script performance as your actual users experience it — not just in synthetic tests.
Privacy-first, Dev-friendly
Does not require consent in GDPR regions and integrates seamlessly with dev tools.


Use our standard dashboard UI or connect through MCP to your AI tools

Explore detailed answers to the most commonly asked questions about our platform, features, integrations

What does the Catch Metrics RUM script actually measure?
Core Web Vitals (LCP, CLS, INP), navigation timings, JavaScript long tasks, third‑party impact, device/geo breakdowns, and user session context — so you see what real visitors experience, not just lab tests.
How is RUM different from synthetic testing?
Synthetic tests run in controlled lab conditions; RUM captures real user traffic across devices, networks, and journeys. We use both for our clients. Our lab tests are proprietary and not publicly available. Our RUM tool is something we license to you.
Will the snippet slow my site down?
Our snippet loads asynchronously and supports sampling, so you control volume and keep overhead negligible.
How do we install it?
Copy‑paste the snippet (or deploy via your tag manager). You’ll see data flowing within minutes. We provide clear setup steps and verification guidance.
Does it work with single‑page apps (Next.js/React, etc.)?
Yes. We track route changes/virtual pageviews and expose an API to manually mark navigations when needed.
What data do you collect?
Performance timings, technical context (URL, device, browser), and we’re adding optional custom attributes soon.
Are you GDPR/compliance‑friendly?
Yes. We support cookie‑consent workflows, CSP/SRI compatibility, domain allow‑listing, and data‑minimisation controls.
Can we control pageview volume?
Absolutely. We help you set the best sample volume for your business.
Why do our numbers differ from Lighthouse or Search Console?
Lab vs field, testing conditions, user mix, and percentiles (e.g., p75) drive differences. We explain the gaps and map RUM to CrUX where relevant.
Can we export data or use an API?
Yes. We let you pull RUM data via API and export for your warehouse or dashboards when you need raw access.
Do you filter bots and internal traffic?
Yes. We exclude known bot traffic and let you fine‑tune rules for cleaner data.
How long do you keep data?
Data retention and export options are configurable; long‑term retention is available based on your plan.

Download our service guide to understand how
we can help you optimise your site speed